What is Candlestick Pattern?
A candlestick is a way of displaying information about an asset’s price movement. Candlestick charts are one of the most popular components of technical analysis, enabling traders to interpret price information quickly and from just a few price bars.
This article focuses on a daily chart, wherein each candlestick details a single day’s trading. It has three basic features:
- The body, which represents the open-to-close range
- The wick, or shadow, that indicates the intra-day high and low
- The colour, which reveals the direction of market movement – a green (or white) body indicates a price increase, while a red (or black) body shows a price decrease
14 POWERFULL CANDLESTICKS PATTERN
Hammer
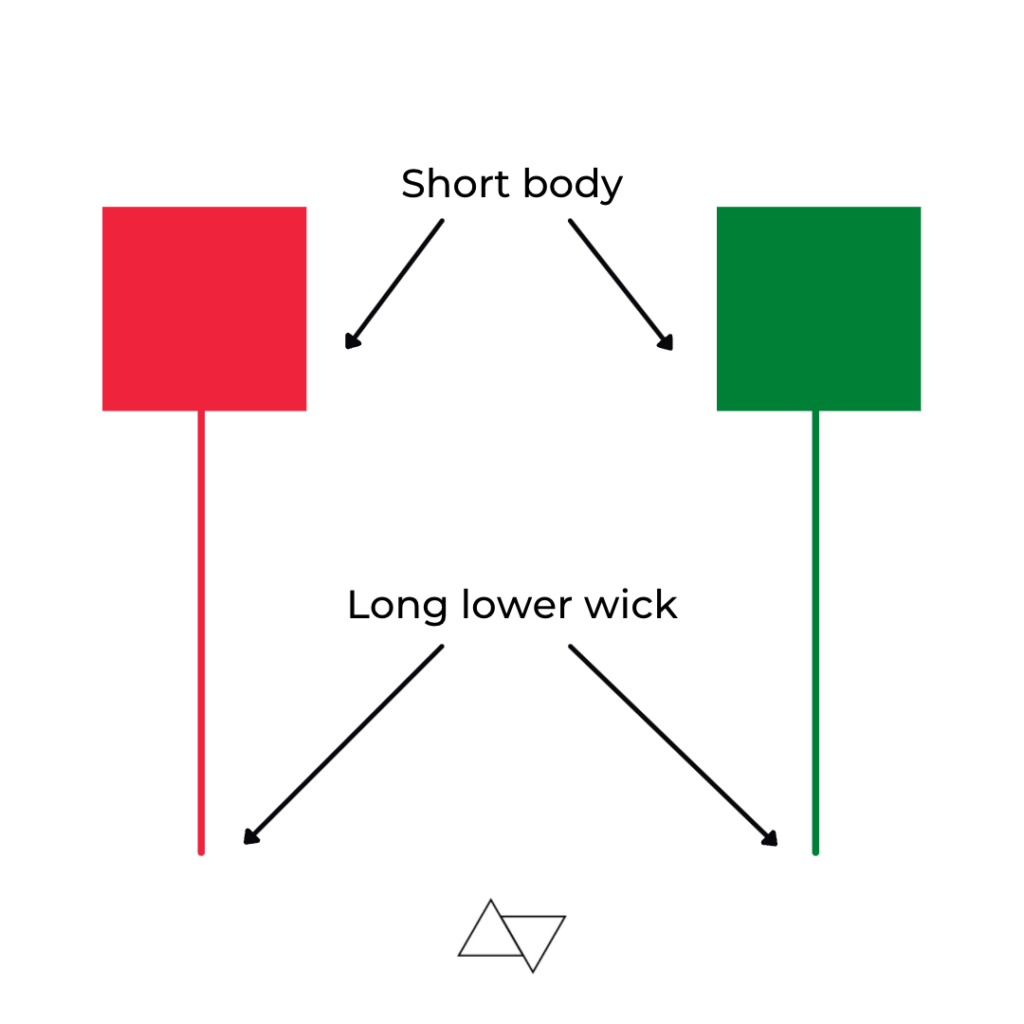
A hammer candlestick pattern occurs when a security trades significantly lower than its opening but then rallies to close near its opening price. The hammer-shaped candlestick that appears on the chart has a lower shadow at least twice the size of the real body.
https://www.chartingskills.com/hammer-candlestick-pattern/
हैमर कैंडलस्टिक पैटर्न तब होता है जब कोई सुरक्षा अपने शुरुआती मूल्य से काफी कम कीमत पर ट्रेड करती है, लेकिन फिर अपने शुरुआती मूल्य के करीब बंद होने के लिए रैली करती है। चार्ट पर दिखाई देने वाली हैमर के आकार की कैंडलस्टिक में वास्तविक बॉडी के आकार से कम से कम दोगुने आकार की निचली छाया होती है।

INVERTED HAMMER
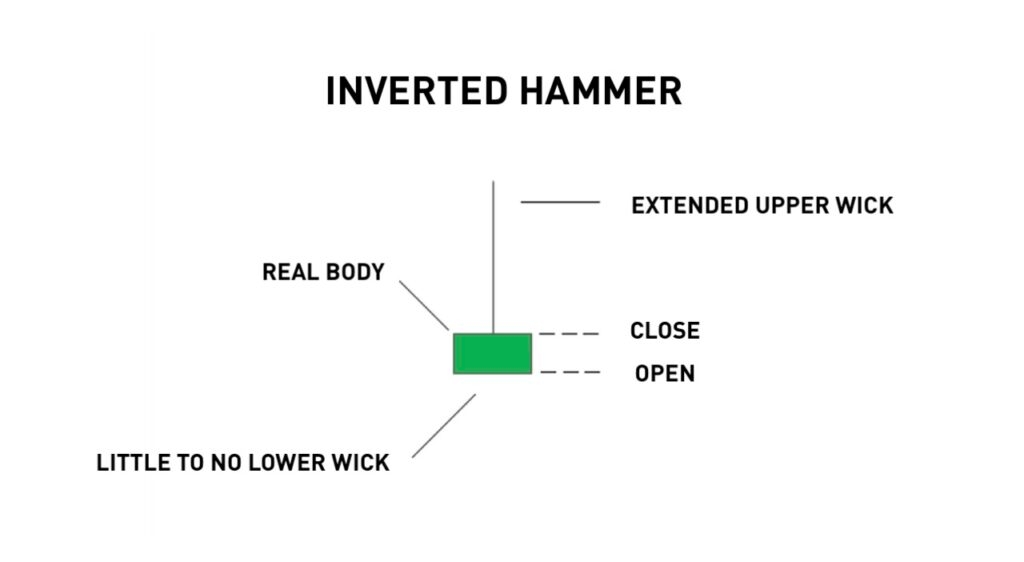
INVERTED HAMMER is a candlestick Pattern which forms after downtrend or 10-12 bearish candles. Inverted Hammer is a candlestick pattern which shadow is twice his body.
इनवर्टेड हैमर एक कैंडलस्टिक पैटर्न है जो डाउनट्रेंड या 10-12 मंदी की मोमबत्तियों के बाद बनता है। इनवर्टेड हैमर एक कैंडलस्टिक पैटर्न है जिसकी छाया उसके शरीर से दोगुनी होती है।
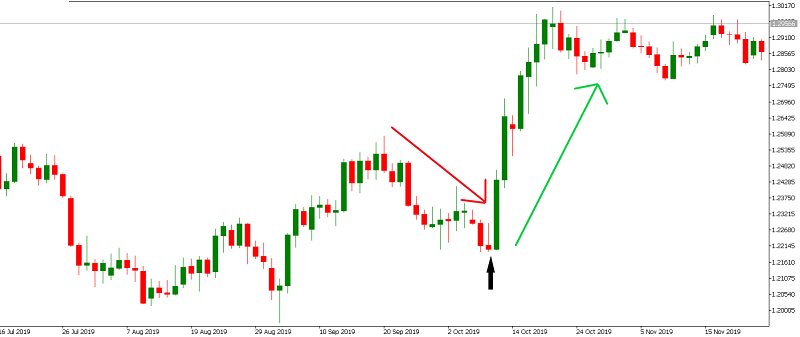
DRAGONFLY DOJI
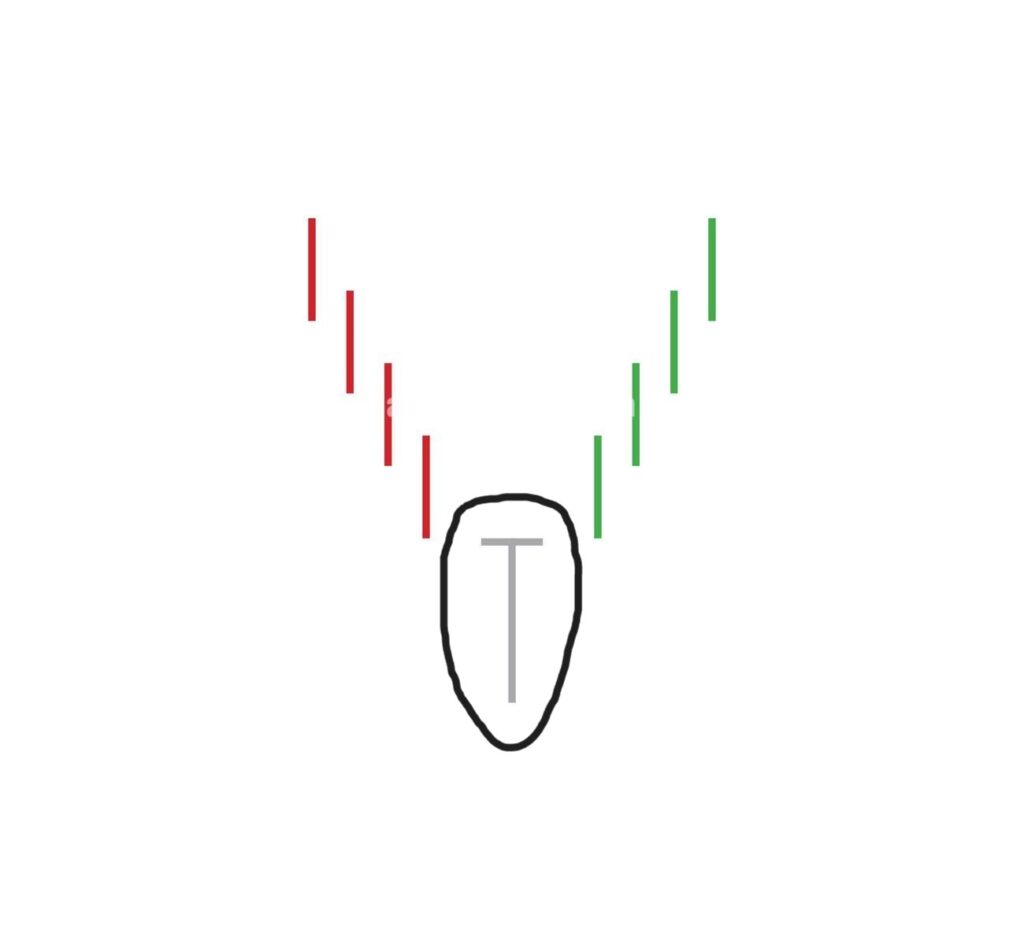
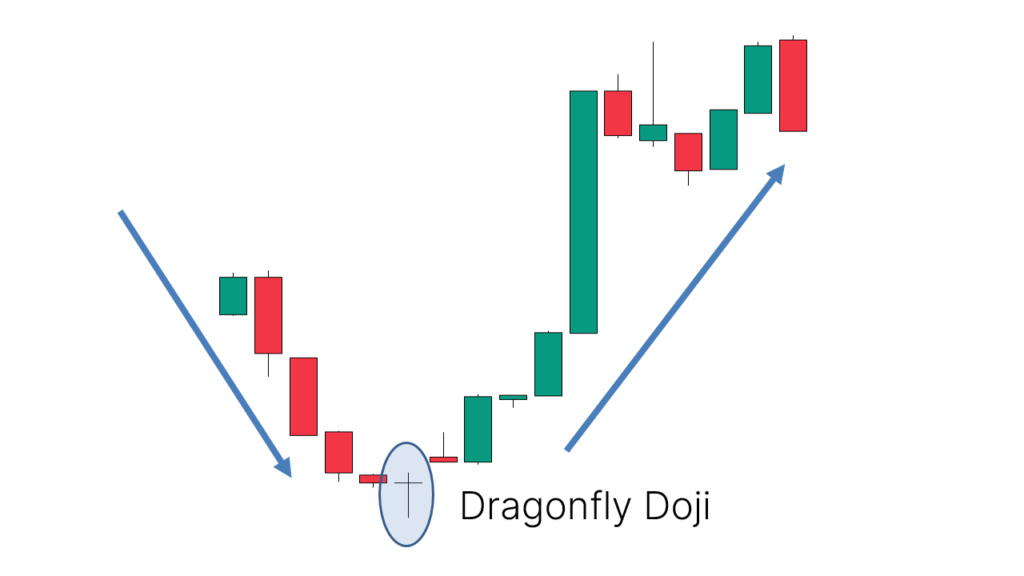
It forms after downtrend or 10-12 red candles. Dragonfly Doji is a candle pattern with no real body and a long downward shadow. It indicates trend reversal.
यह डाउनट्रेंड या 10-12 लाल Candles के बाद बनता है। DRAGONFLY DOJI एक candle पैटर्न है जिसमें कोई वास्तविक बॉडी नहीं होती और एक लंबी नीचे की ओर छाया होती है। यह ट्रेंड रिवर्सल को दर्शाता है।
BULLISH ENGULFING
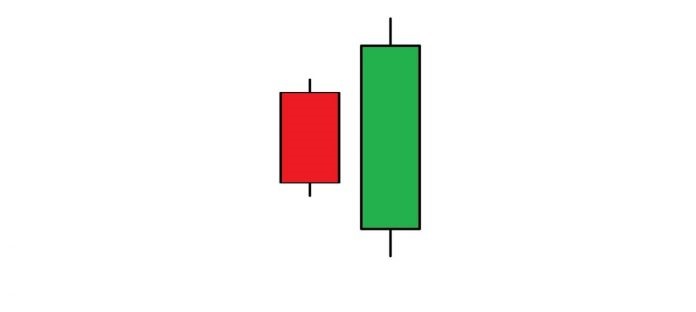
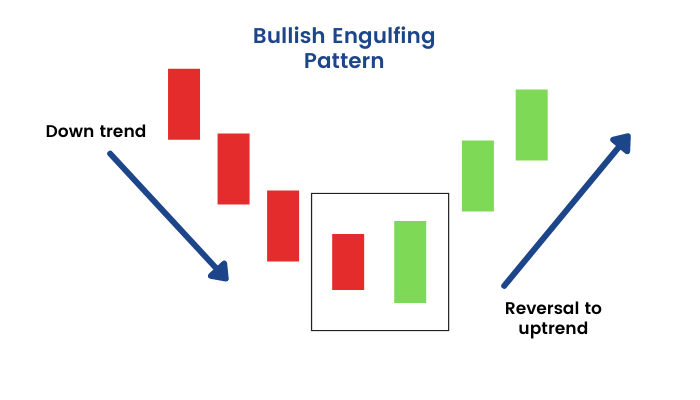
A bullish engulfing pattern is a white candlestick that closes higher than the previous Candle’s opening after opening lower than the previous Candle’s close.
बुलिश एनगल्फिंग पैटर्न एक सफेद कैंडलस्टिक है जो पिछली कैंडल के बंद होने से कम पर खुलने के बाद पिछली कैंडल के खुलने से अधिक पर बंद होती है।
Piercing line
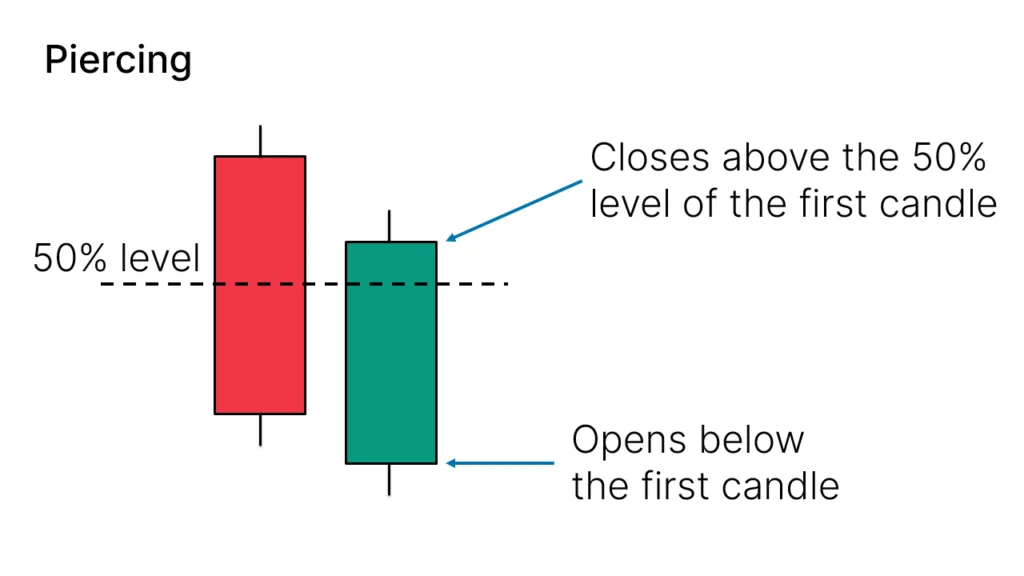
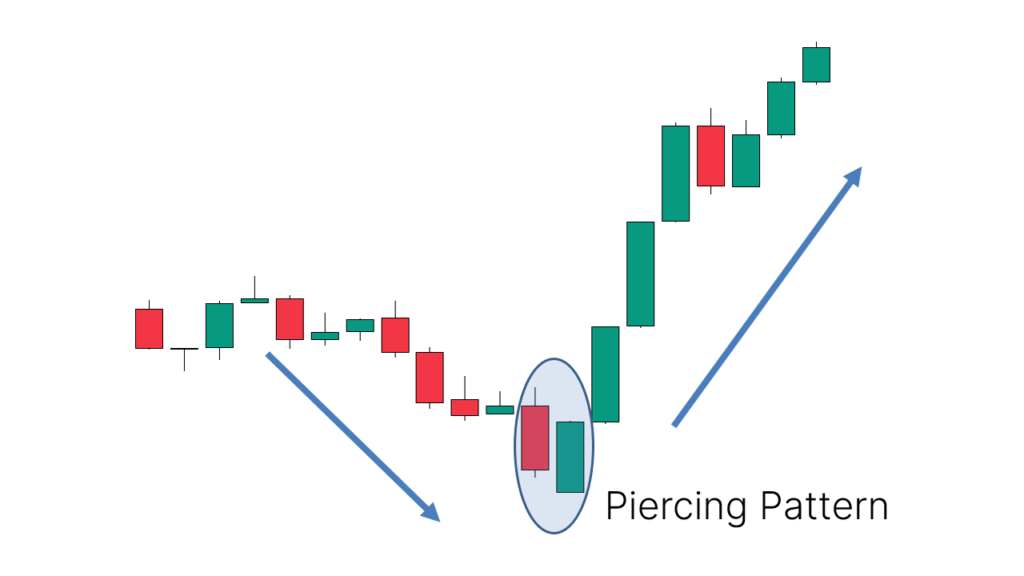
Piercing Pattern Candlestick forms after downtrend or 10-12 red candles. It indicates trend reversal and uptrend has started. It engulfs previous red candle more then 50%.
Piercing Pattern Candlestick डाउनट्रेंड या 10-12 लाल कैंडल के बाद बनता है। यह ट्रेंड रिवर्सल और अपट्रेंड शुरू होने का संकेत देता है। यह पिछली लाल मोमबत्ती को 50% से अधिक घेर लेता है।
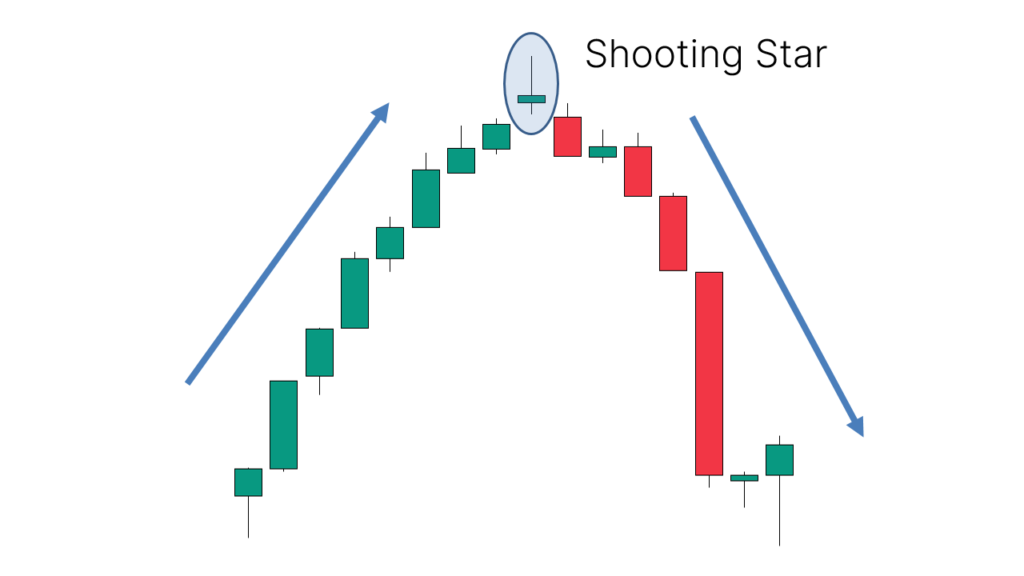
Shooting star
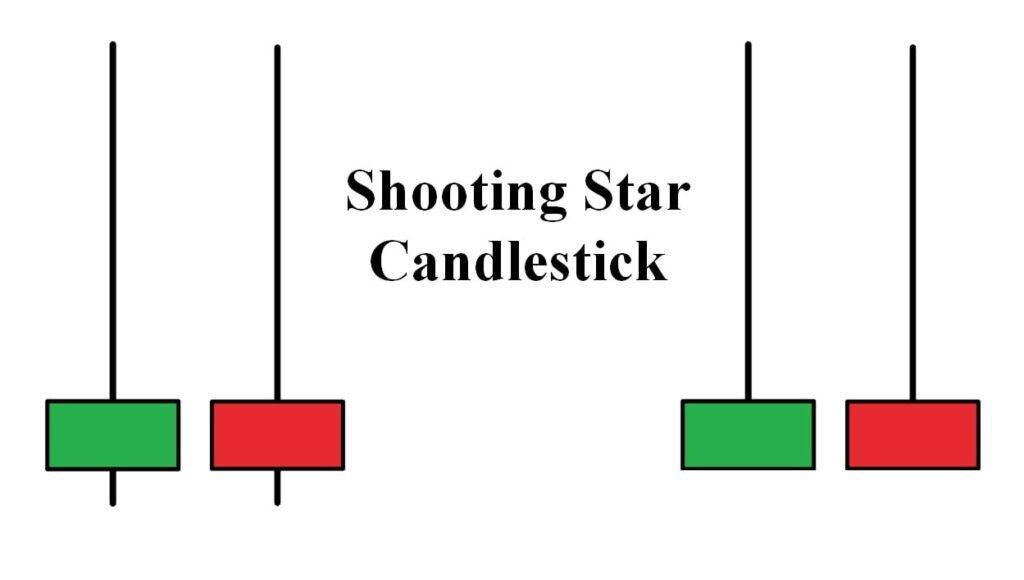
Shooting Star is a Candlestick Pattern that indicates downtrend has started. It forms after Uptrend or 10-12 Green candle. Shooting Star has longer wick twice it’s body.
शूटिंग स्टार एक कैंडलस्टिक पैटर्न है जो डाउनट्रेंड शुरू होने का संकेत देता है। यह अपट्रेंड या 10-12 ग्रीन कैंडल के बाद बनता है। शूटिंग स्टार की बाती इसकी बॉडी से दोगुनी लंबी होती है।
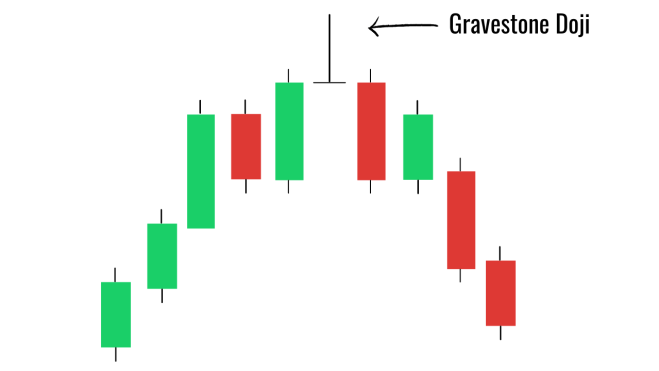
Gravestone Doji
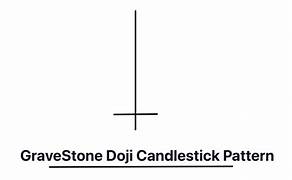
Gravestone Doji is a bearish reversal candlestick pattern that is formed when the open, low, and closing prices are all near each other with a long upper wick. Gravestone Doji forms after uptrend. It indicates trend reversal.
Gravestone Doji एक मंदी का रिवर्सल कैंडलस्टिक पैटर्न है जो तब बनता है जब ओपन, लो और क्लोजिंग कीमतें एक दूसरे के पास होती हैं और ऊपरी बाती लंबी होती है। ग्रेवस्टोन डोजी अपट्रेंड के बाद बनता है। यह ट्रेंड रिवर्सल को दर्शाता है।
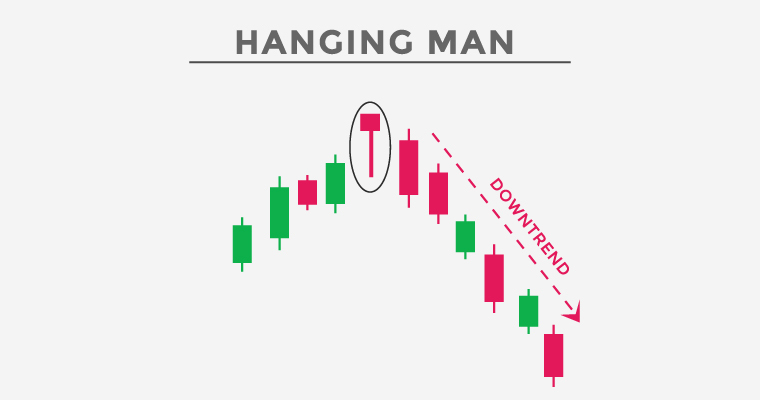
HANGING MAN
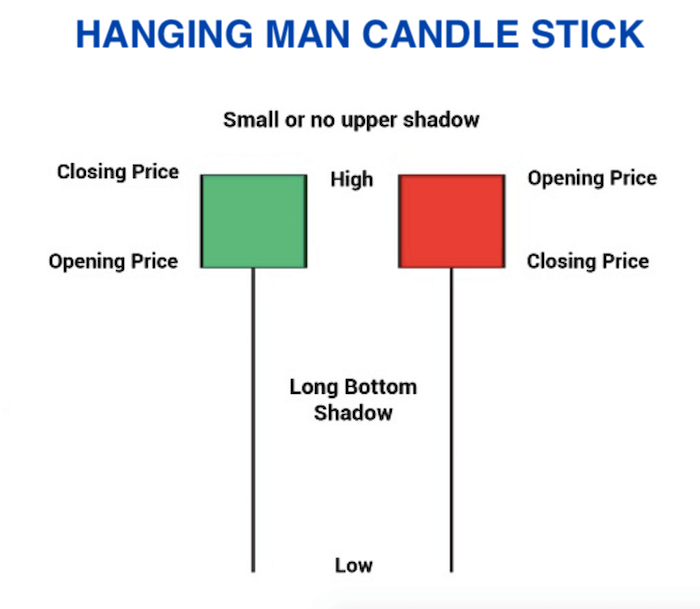
Hanging man candlestick pattern forms after uptrend or 10-12 candles. It indicates trend reversal. Hanging man has small body and longer lower wick.
Hanging man Candlestock Pattern अपट्रेंड या 10-12 कैंडल के बाद बनता है। यह ट्रेंड रिवर्सल को दर्शाता है। हैंगिंग मैन का शरीर छोटा और निचली बाती लंबी होती है।
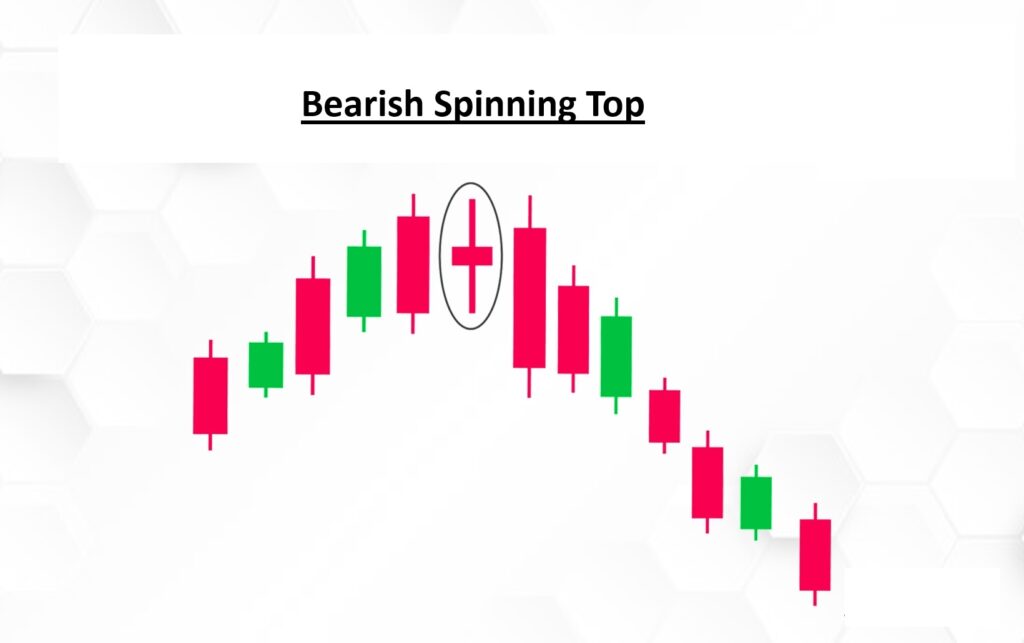
Bearish Spinning Top
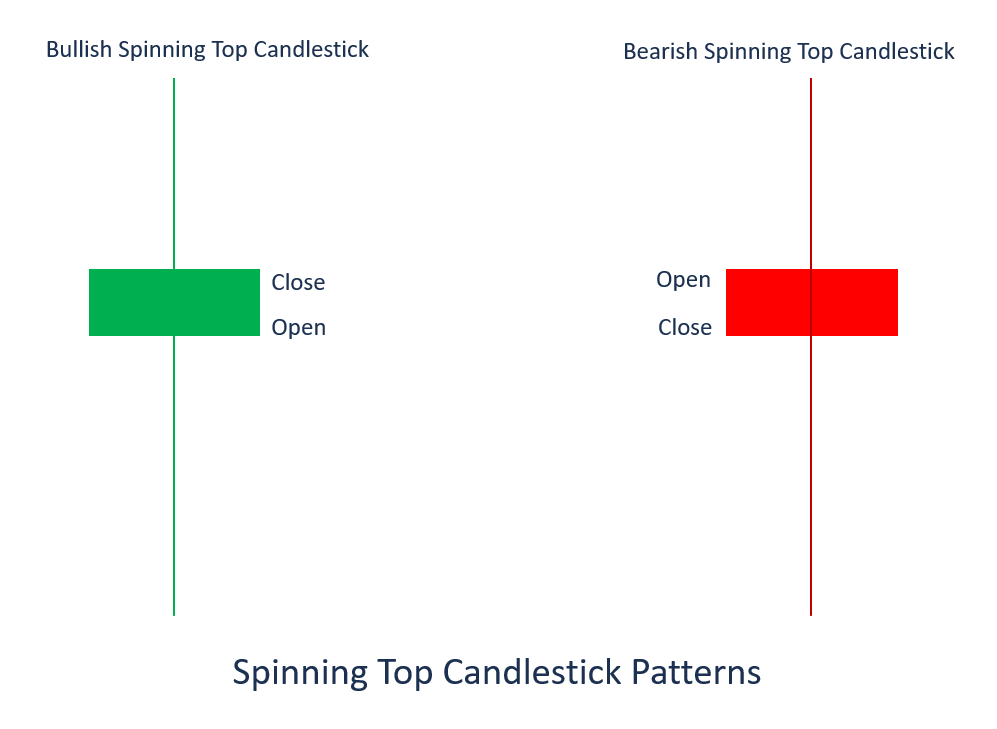
Bearish spinning top is a single candlestick pattern that represents indecision about the future price movement. Bearish spinning top candlestick pattern has a short real body with upper and lower shadows longer than the body.
Bearish Spinning Top एक सिंगल कैंडलस्टिक पैटर्न है जो भविष्य की कीमत चाल के बारे में अनिर्णय को दर्शाता है। Bearish Spinning Top कैंडलस्टिक पैटर्न में एक छोटी रियल बॉडी होती है जिसमें ऊपरी और निचली छायाएं बॉडी से लंबी होती हैं।
Bearish engulfing
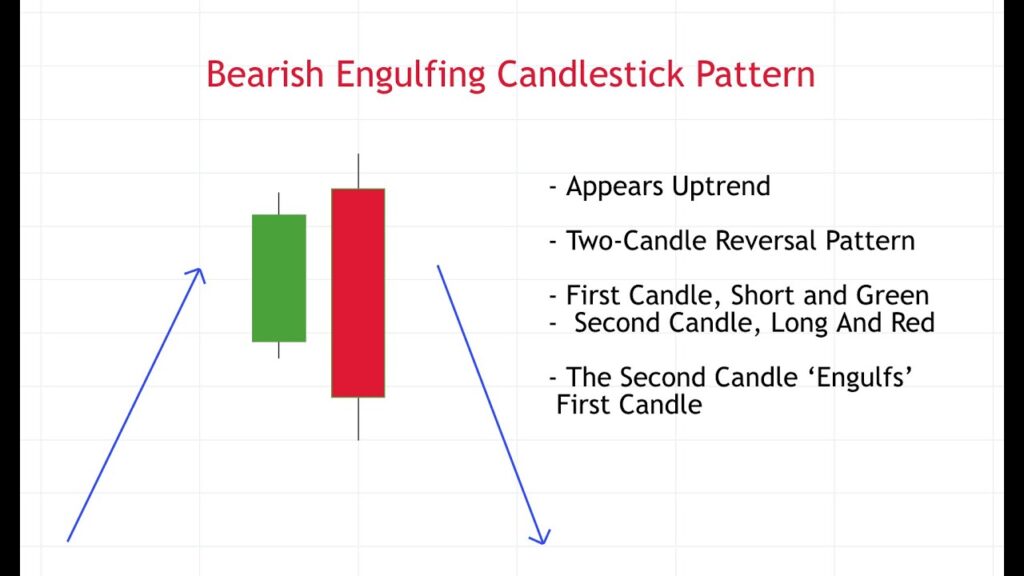
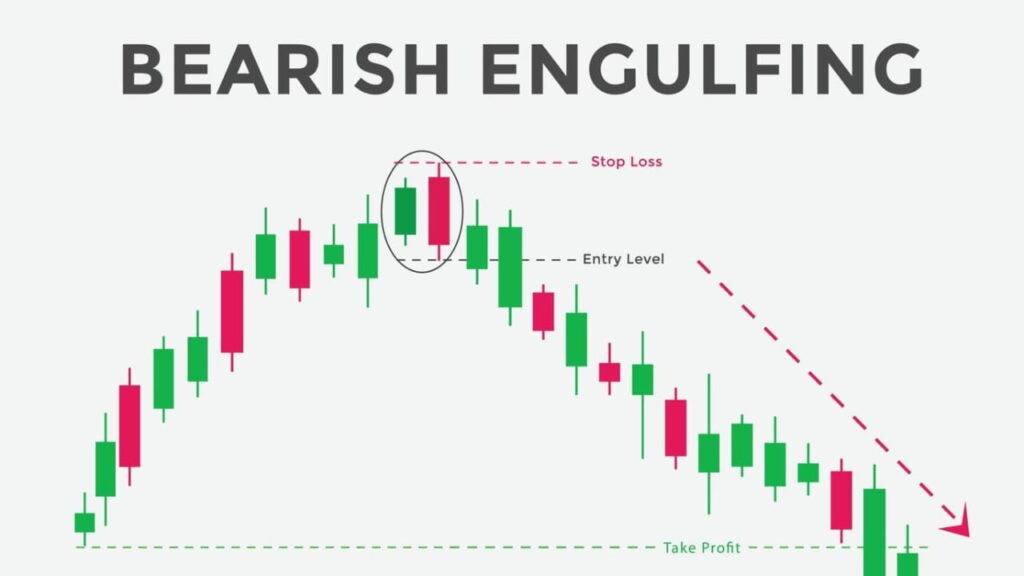
Bearish Engulfing Candlestick Pattern form after uptrend or 10-12 candles. Bearish Engulfing Engulf Previous green candle on Resistence. It indicates trend reversal.
Bearish Engulfing Candlestick Pattern अपट्रेंड या 10-12 कैंडल के बाद बनता है। बेयरिश एंगुल्फिंग Resistence पर पिछली हरी कैंडल को एंगुल्फ करता है। यह ट्रेंड रिवर्सल को दर्शाता है।
Morning star
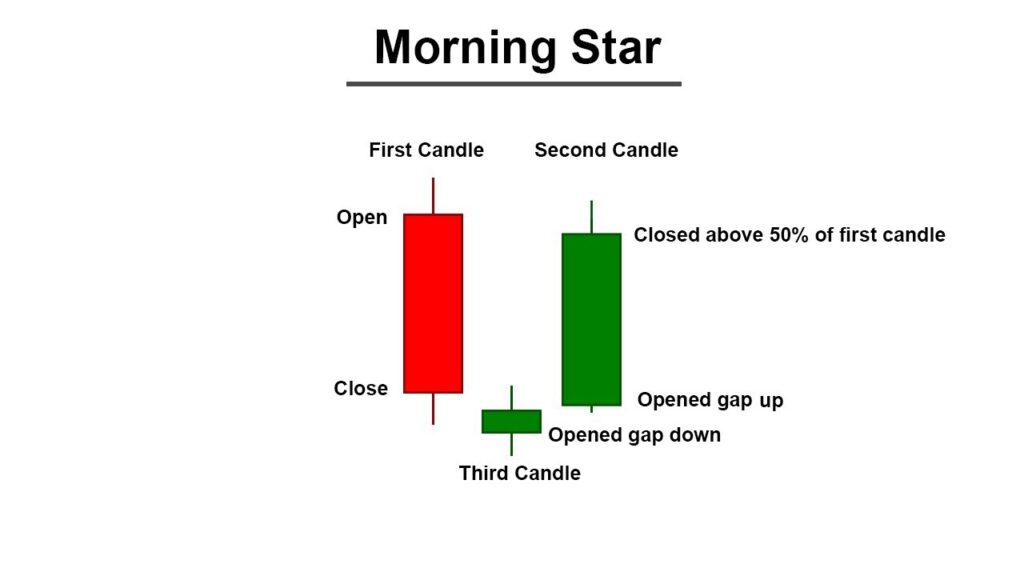
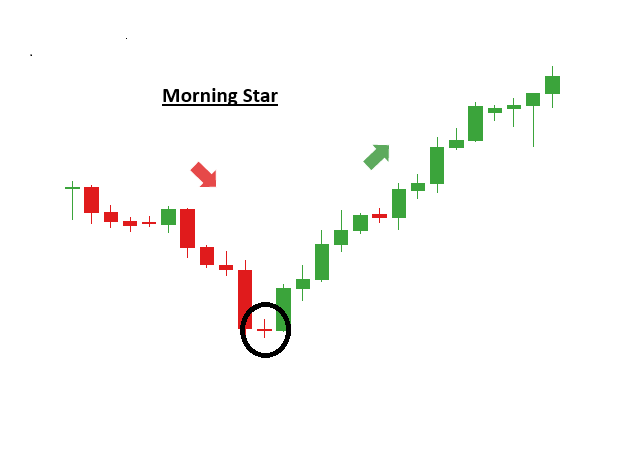
Morning Star Candlestick Pattern forms after Downtrend or 10-12 candles. Morning Star is composed of three candles. The first candle is a long red candle that continues the prior downtrend. The second candle gaps down from the first candle’s low and has a small real body, forming a doji or spinning top that indicates market indecision. The third candle gaps up from the second candle’s low and closes above the midpoint of the first candle’s body.
Morning Star Candlestick Pattern डाउनट्रेंड या 10-12 कैंडल के बाद बनता है। मॉर्निंग स्टार तीन कैंडल से बना होता है। पहली कैंडल एक लंबी लाल कैंडल होती है जो पिछले डाउनट्रेंड को जारी रखती है। दूसरी कैंडल पहली कैंडल के निचले स्तर से नीचे गिरती है और इसकी रियल बॉडी छोटी होती है, जो डोजी या स्पिनिंग टॉप बनाती है जो बाजार में अनिर्णय को दर्शाती है। तीसरी कैंडल दूसरी कैंडल के निचले स्तर से ऊपर गिरती है और पहली कैंडल की बॉडी के मध्य बिंदु से ऊपर बंद होती है।
Evening Star
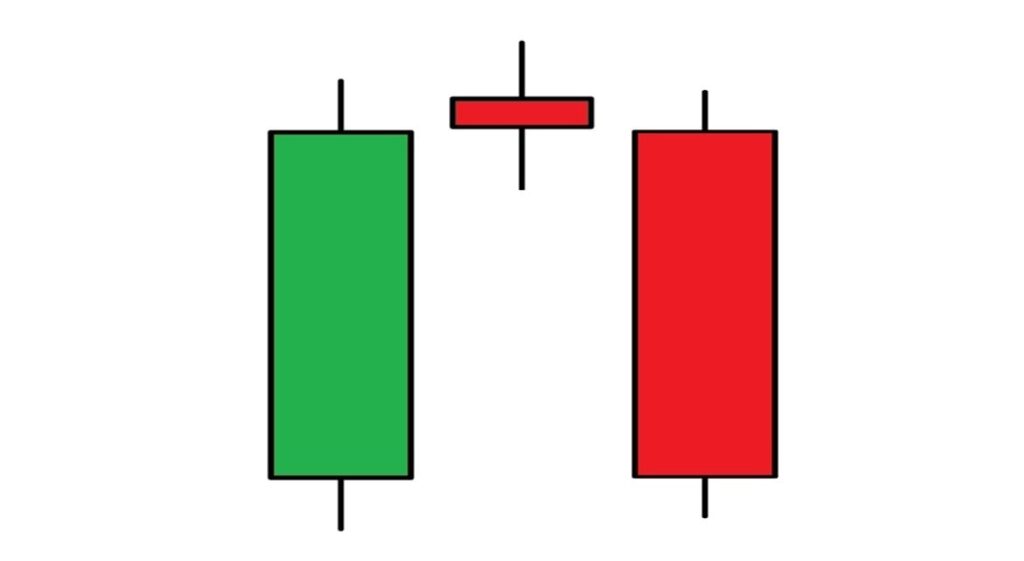
Evening Star pattern is a candlestick pattern that appears at the top of the uptrend and predicts that a downtrend is approaching. An Evening Star is a bearish reversal candlestick pattern comprising three candles: one big bullish candlestick, one small-bodied candle, and one bearish candle.
Evening Star candlestick pattern एक कैंडलस्टिक पैटर्न है जो अपट्रेंड के शीर्ष पर दिखाई देता है और भविष्यवाणी करता है कि डाउनट्रेंड आ रहा है। Evening Star एक मंदी का उलटा कैंडलस्टिक पैटर्न है जिसमें तीन Candles शामिल हैं: एक बड़ी तेजी वाली कैंडलस्टिक, एक छोटी बॉडी वाली कैंडल और एक मंदी वाली कैंडल।

Long Legged Doji
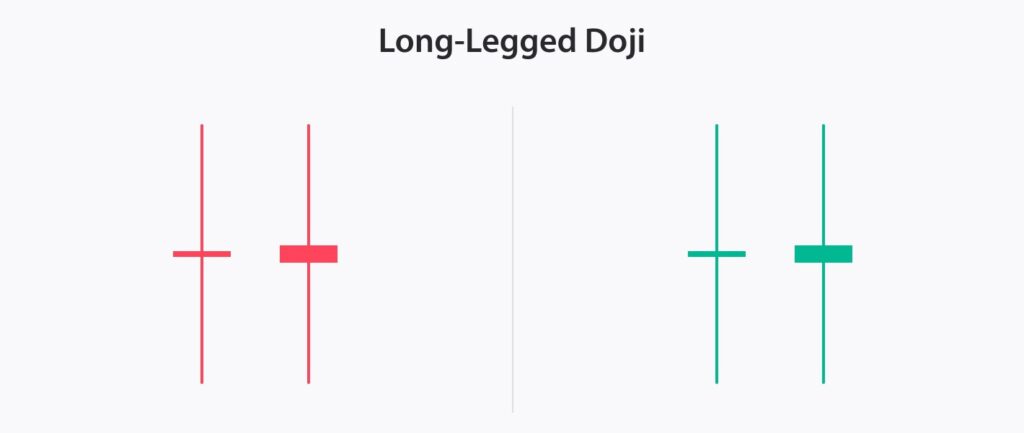
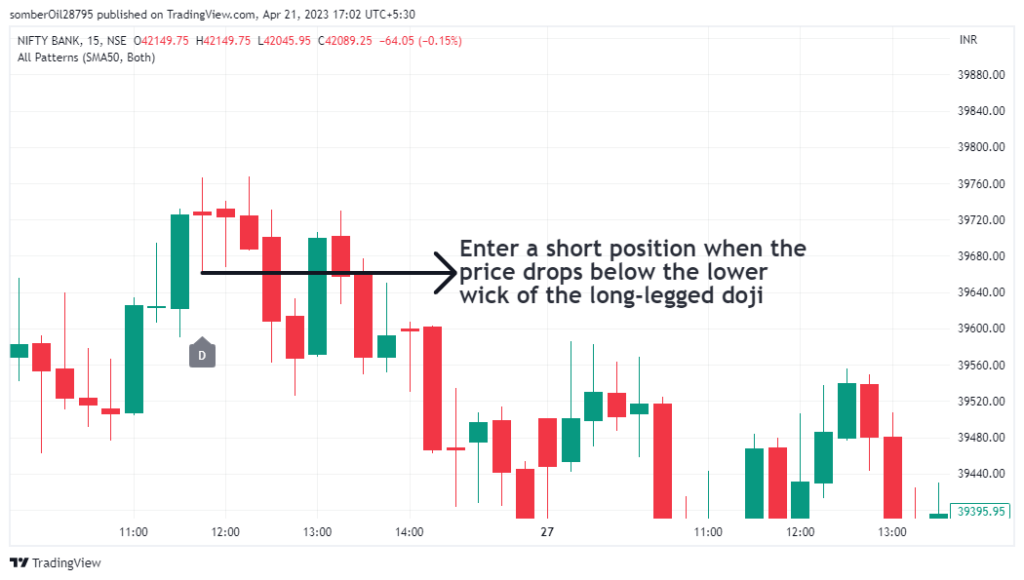
Long Legged Doji forms after Uptrend or Downtrend. Long Legged Doji has long upper and lower wick. Long Legged Doji has same opening and closing price.
Long Legged Doji अपट्रेंड या डाउनट्रेंड के बाद बनता है। Long Legged Doji में लंबी ऊपरी और निचली विक होती है। Long Legged Doji की शुरुआती और समापन कीमत एक जैसी होती है
Three White Soldiers
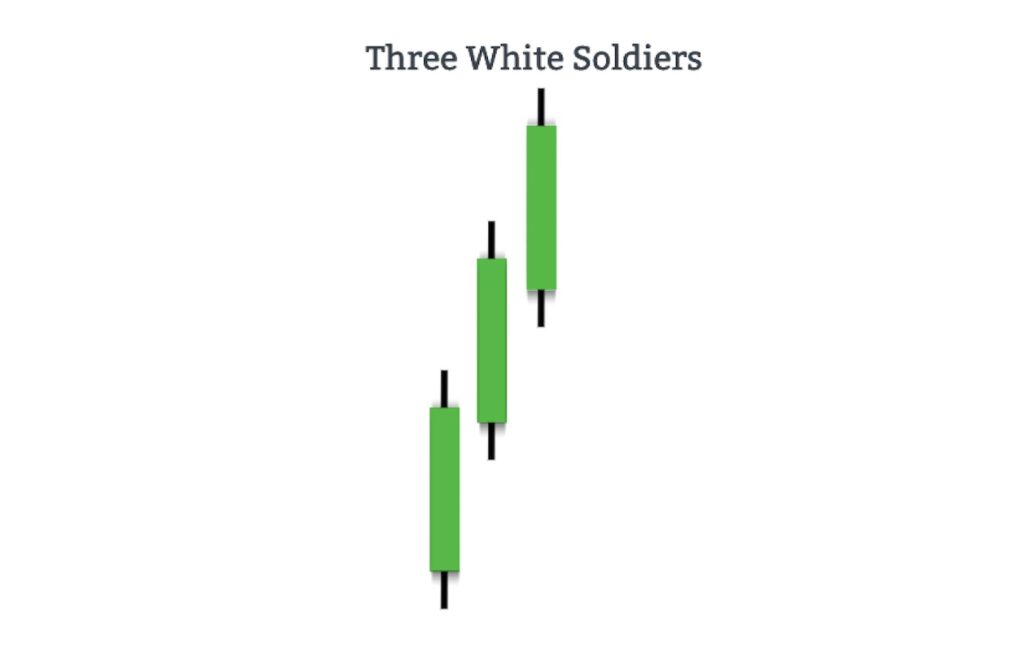
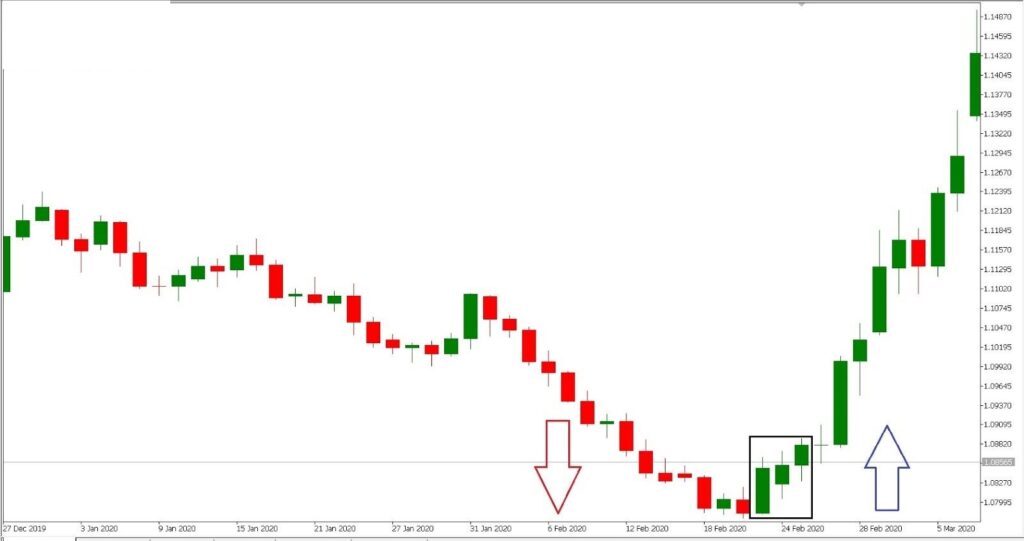
Three White Soldiers Perform after downtrend. Three White Soldiers has Longer body but short wick. It indicates that uptrend has started.
Three White Soldiers डाउनट्रेंड के बाद प्रदर्शन करते हैं। Three White Soldiers का शरीर लंबा है लेकिन बाती छोटी है। यह दर्शाता है कि अपट्रेंड शुरू हो गया है !
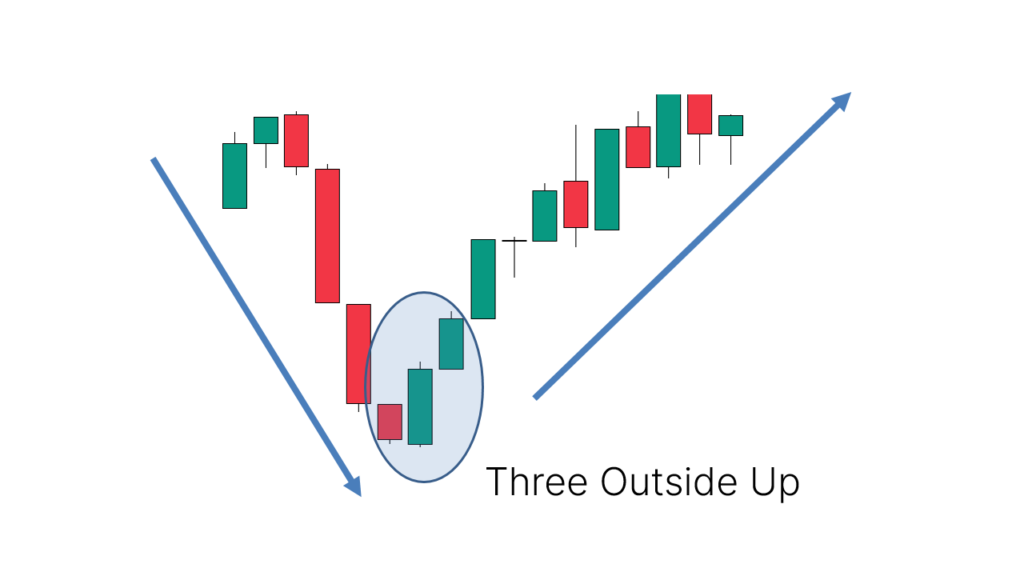
Three Outside Up
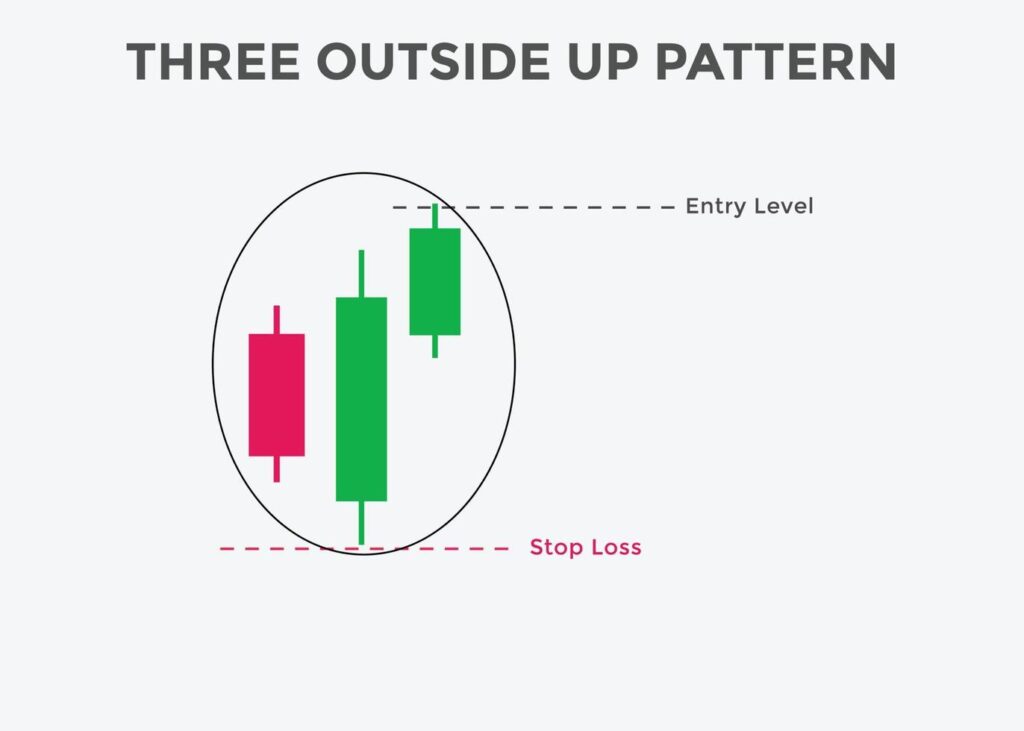
It Forms after downtrend or 10-12 Candles. Second candle of this Pattern engulf Previous Candle Completely and third candle breaks second candle’s high. It indicates that uptrend has started.
यह डाउनट्रेंड या 10-12 कैंडल के बाद बनता है। इस पैटर्न की दूसरी कैंडल पिछली कैंडल को पूरी तरह से निगल लेती है और तीसरी कैंडल दूसरी कैंडल के हाई को तोड़ देती है। यह दर्शाता है कि अपट्रेंड शुरू हो गया है।
